Enrollment Profiles contain key characteristics of The Citadel’s students enrolled each semester.
This data is collected at the time of the College’s official census date. Therefore, it represents a snapshot of The Citadel’s official enrollment data.
Fall 2025 Enrollment Snapshot
South Carolina Corps of Cadets
SCCC Enrollment by Residency
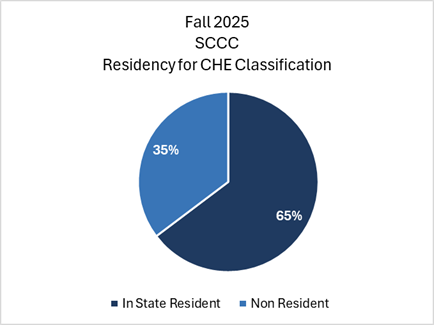
| CHE Residency Classification | Count |
|---|---|
| In-State Resident | 1356 |
| Non-Resident | 853 |
| Military Personnel & Dependents (A)* | 2 |
| Retired Persons & Dependents (D)* | 1 |
| Scholarships Provided by BOV (F)* | 54 |
| Veteran Benefits (I)* | 142 |
| Total | 2417 |
*Residency Exception – “In-State Residency” for CHE Residency Classification for Fee Purposes
SCCC Enrollment by Cadet Status
| Cadet Year | Count |
|---|---|
| 1st Year Cadet | 730 |
| 2nd Year Cadet | 597 |
| 3rd Year Cadet | 565 |
| 4th Year Cadet | 524 |
| Veteran Cadet | 1 |
| Total | 2417 |
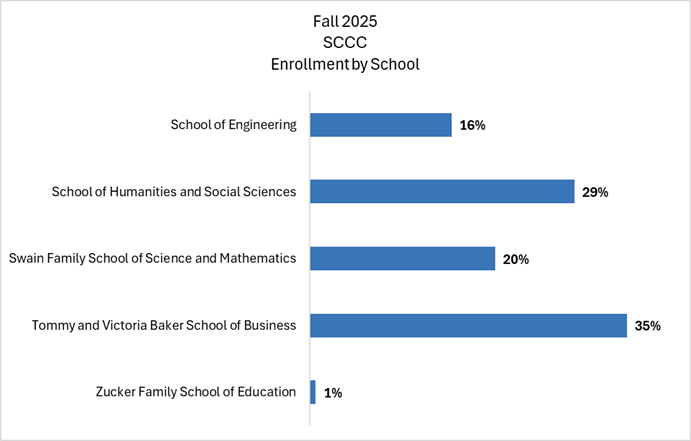
SCCC Enrollment by School
SCCC Enrollment by Major
| Primary Major | Count | Percent |
|---|---|---|
| Accounting | 40 | 1.7% |
| Biology | 84 | 3.5% |
| Business Administration | 1 | 0.0% |
| Chemistry | 37 | 1.5% |
| Civil Engineering | 79 | 3.3% |
| Computer Engineering | 6 | 0.2% |
| Computer Science | 39 | 1.6% |
| Construction Engineering | 67 | 2.8% |
| Criminal Justice | 124 | 5.1% |
| Cyber Operations | 80 | 3.3% |
| Electrical Engineering | 48 | 2.0% |
| English | 8 | 0.3% |
| Exercise Science | 106 | 4.4% |
| Finance | 201 | 8.3% |
| History | 53 | 2.2% |
| Intelligence and Security Studies | 346 | 14.3% |
| Management | 238 | 9.8% |
| Marketing & Business Development | 217 | 9.0% |
| Mathematics | 10 | 0.4% |
| Mechanical Engineering | 175 | 7.2% |
| Modern Languages | 4 | 0.2% |
| Nursing | 50 | 2.1% |
| Physical Education | 14 | 0.6% |
| Physics | 24 | 1.0% |
| Political Science | 120 | 5.0% |
| Pre-Secondary Education | 3 | 0.1% |
| Psychology | 45 | 1.9% |
| Secondary Education | 12 | 0.5% |
| Sport Management | 45 | 1.9% |
| Supply Chain Management | 141 | 5.8% |
| Total | 2417 | 100.0% |
All Citadel Students
Enrollment by Student Level
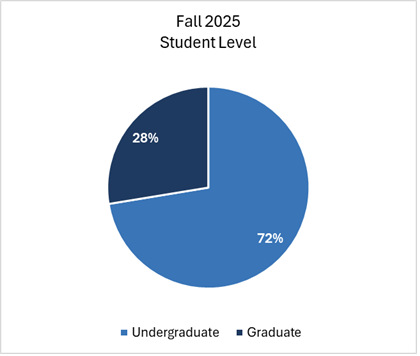
| Student Level | Count | Percent |
|---|---|---|
| Graduate | 1085 | 28% |
| Undergraduate | 2848 | 72% |
Enrollment by Residency
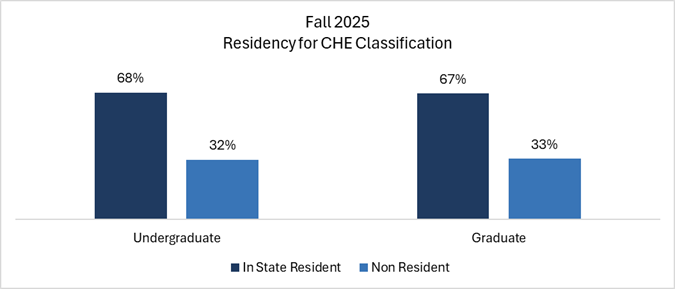
| Residency for CHE Classification | Graduate | Undergraduate | ||
|---|---|---|---|---|
| Count | Percent | Count | Percent | |
| In-State Resident | 732 | 67% | 1938 | 68% |
| Non-Resident | 353 | 33% | 910 | 32% |
| CHE Residency Classification | Count |
|---|---|
| In-State Resident | 2403 |
| Non-Resident | 1263 |
| Military Personnel & Dependents (A)* | 6 |
| Faculty & Administration Employees & Dependents (B)* | 1 |
| Full-Time Employees & Dependents (C)* | 1 |
| Retired Persons & Dependents (D)* | 1 |
| Scholarships Provided by BOV (F)* | 59 |
| Veteran Benefits (I)* | 199 |
| Total | 3933 |
*Residency Exception – “In-State Residency” for CHE Residency Classification for Fee Purposes
Enrollment by Student Type
| Student Type | Count | Percent |
|---|---|---|
| Active Duty | 31 | 1% |
| Cadet | 2417 | 61% |
| Degree Completion Student | 255 | 6% |
| Fifth Year Student | 31 | 1% |
| Graduate Student | 1085 | 28% |
| Transient Student | 22 | 1% |
| Veteran Student | 92 | 2% |
| Total | 3933 | 100% |
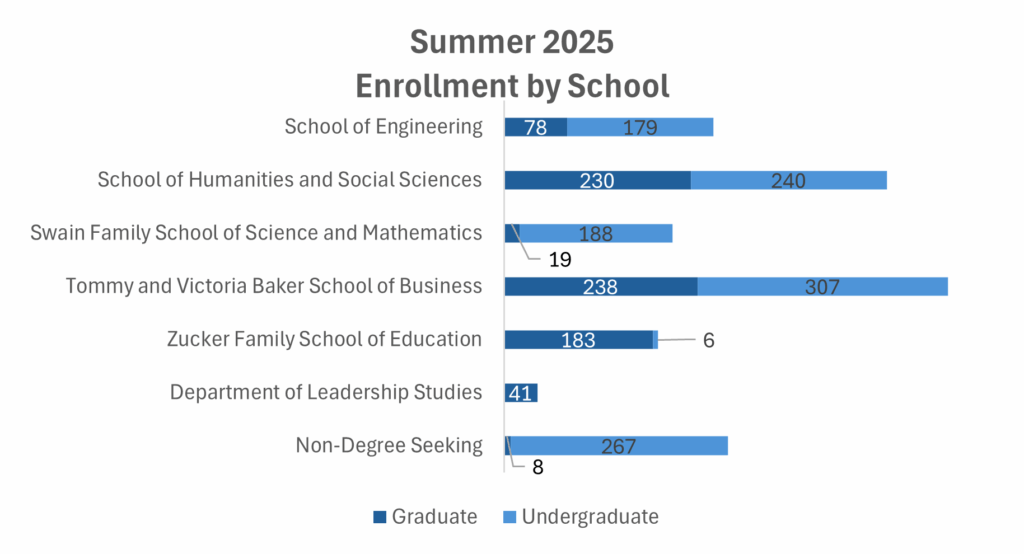
Enrollment by School
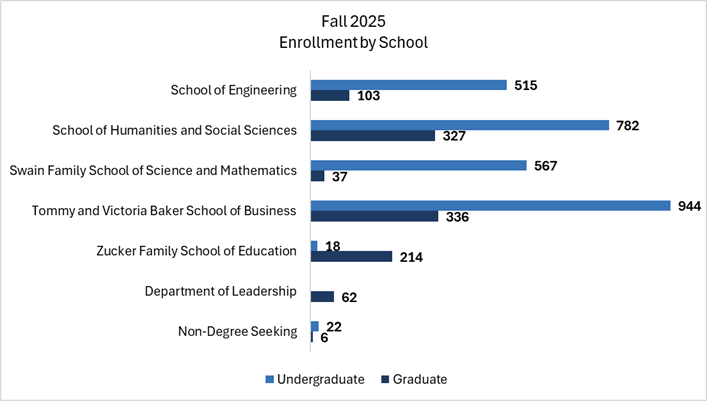
| School | Graduate | Undergraduate |
|---|---|---|
| School of Engineering | 103 | 515 |
| School of Humanities and Social Sciences | 327 | 782 |
| Swain Family School of Science and Mathematics | 37 | 567 |
| Tommy and Victoria Baker School of Business | 336 | 944 |
| Zucker Family School of Education | 214 | 18 |
| Department of Leadership Studies | 62 | 0 |
| Non-Degree Seeking | 6 | 22 |
| Total | 1085 | 2845 |
Summer 2025 Enrollment Snapshot
Student Level
| Student Level | Count | Percent |
|---|---|---|
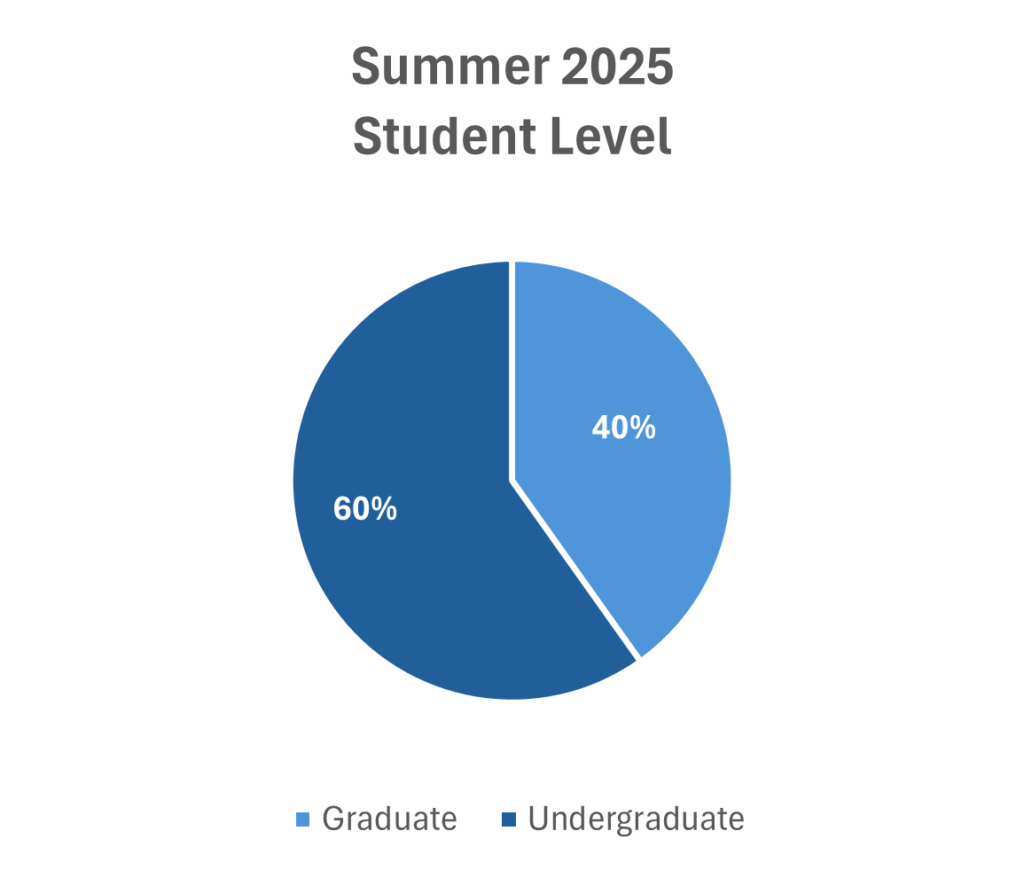
| Graduate | 797 | 40% |
| Undergraduate | 1187 | 60% |
| Total | 1984 | 100% |
Residency
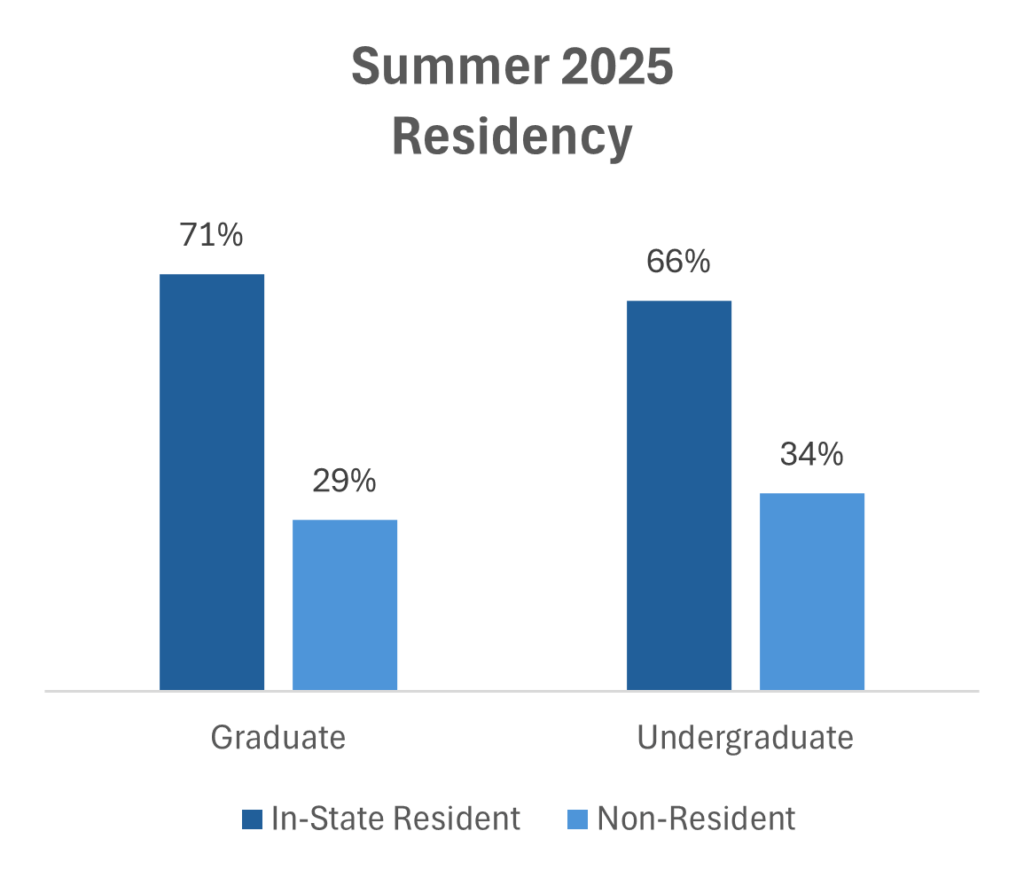
| Non-Resident | In-State Resident | Veteran Benefits* (I) | Full-Time Employees & Dependents* (C) | Retired Persons & Dependents*(D) | Scholarships provided by BOV* (F) | Military Personnel & Dependents* (A) | Total | |
|---|---|---|---|---|---|---|---|---|
| Graduate | 232 | 556 | 6 | 0 | 0 | 2 | 1 | 797 |
| Undergraduate | 399 | 679 | 83 | 1 | 1 | 19 | 5 | 1187 |
| Total | 631 | 1235 | 89 | 1 | 1 | 21 | 6 | 1984 |
*Residency Exception – “In-State Residency” for CHE Residency Classification for Fee Purposes
Gender
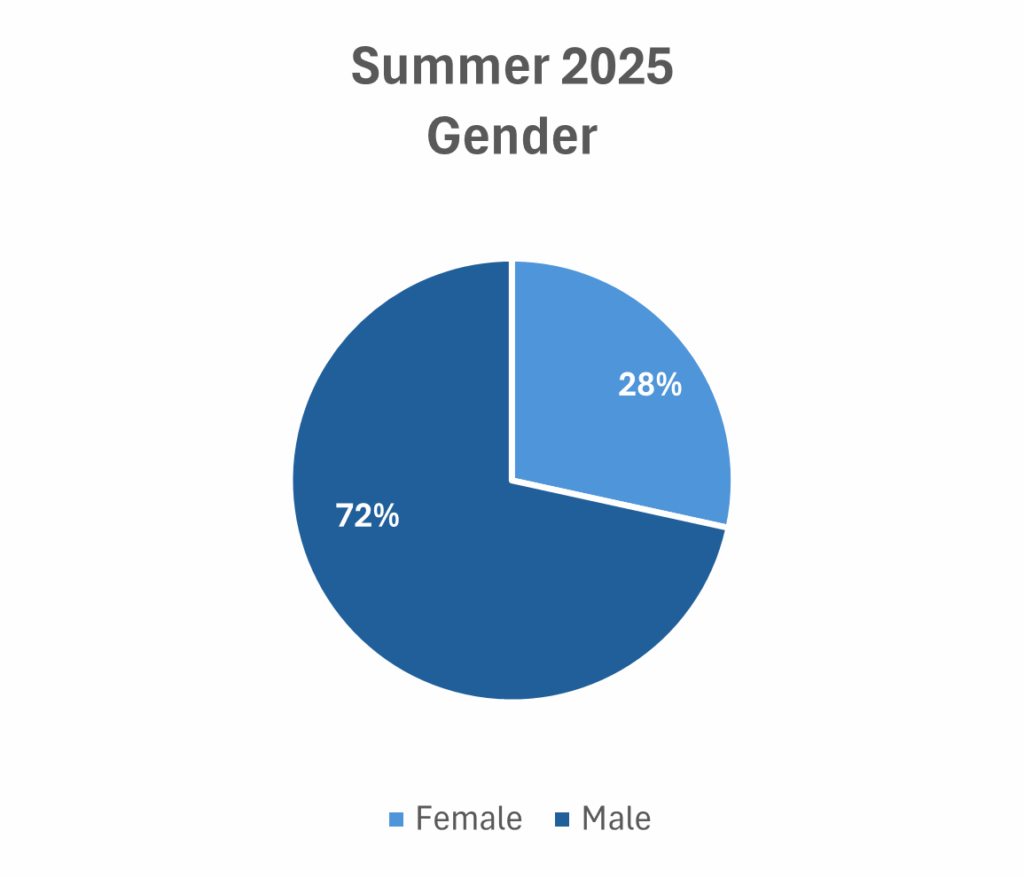
| Student Type | Female | Male |
|---|---|---|
| Active Duty | 0 | 27 |
| Cadets | 87 | 524 |
| College Transfer Program Students | 70 | 165 |
| Fifth Year Day Students | 2 | 12 |
| Graduate | 373 | 423 |
| Veteran Day Students | 7 | 39 |
| Non-Degree Seeking | 25 | 230 |
| Total | 564 | 1420 |
Race/Ethnicity
| Student Type | American Indian or Alaskan Native | Asian | Black or African American | Hispanic | More than 1 Race | Native Hawaiian or Pacific Islander | Non-Resident Alien | Unknown | White | Total |
|---|---|---|---|---|---|---|---|---|---|---|
| Active Duty | 1 | 0 | 2 | 3 | 4 | 0 | 0 | 0 | 17 | 27 |
| Cadets | 2 | 10 | 59 | 55 | 25 | 1 | 4 | 7 | 448 | 611 |
| College Transfer Program Students | 0 | 4 | 32 | 30 | 13 | 0 | 1 | 5 | 150 | 235 |
| Fifth Year Day Students | 0 | 1 | 1 | 0 | 0 | 0 | 0 | 0 | 12 | 14 |
| Graduate Students | 2 | 22 | 87 | 52 | 31 | 2 | 1 | 28 | 571 | 796 |
| Veteran Day Students | 1 | 1 | 5 | 6 | 1 | 0 | 0 | 0 | 32 | 46 |
| Non-Degree Seeking | 1 | 6 | 30 | 24 | 13 | 0 | 30 | 5 | 146 | 255 |
| Total | 7 | 44 | 216 | 170 | 87 | 3 | 36 | 45 | 1376 | 1984 |
School Enrollments
| School | Active Duty | Cadets | College Transfer Program Students | Fifth Year Day Students | Graduate Students | Veteran Day Students | Non-Degree Seeking | Total |
|---|---|---|---|---|---|---|---|---|
| School of Engineering | 14 | 73 | 74 | 5 | 77 | 14 | 0 | 257 |
| School of Humanities and Social Sciences | 2 | 181 | 43 | 3 | 230 | 11 | 0 | 470 |
| Swain Family School of Science and Mathematics | 4 | 129 | 47 | 0 | 19 | 8 | 0 | 207 |
| Tommy and Victoria Baker School of Business | 7 | 219 | 60 | 5 | 238 | 12 | 4 | 545 |
| Zucker Family School of Education | 0 | 5 | 0 | 0 | 183 | 1 | 0 | 189 |
| Department of Leadership Studies | 0 | 0 | 0 | 0 | 41 | 0 | 0 | 41 |
| Non-Degree Seeking | 0 | 0 | 11 | 1 | 8 | 0 | 255 | 275 |
| Total | 27 | 607 | 235 | 14 | 796 | 46 | 259 | 1984 |
Undergraduate Enrollment by Primary Program
| Primary Program | Active Duty | Cadets | College Transfer Program Students | Fifth Year Day Students | Veteran Day Students | Non-Degree Seeking | Total |
|---|---|---|---|---|---|---|---|
| Accounting | 1 | 11 | 0 | 0 | 1 | 0 | 13 |
| Biology | 0 | 31 | 1 | 0 | 0 | 0 | 32 |
| Business Administration | 0 | 2 | 60 | 4 | 2 | 0 | 68 |
| Chemistry | 0 | 6 | 0 | 0 | 1 | 0 | 7 |
| Civil Engineering | 1 | 18 | 23 | 3 | 2 | 0 | 47 |
| Computer Engineering | 0 | 1 | 4 | 0 | 2 | 0 | 7 |
| Computer Science | 0 | 7 | 0 | 0 | 0 | 0 | 7 |
| Construction Engineering | 0 | 16 | 2 | 0 | 0 | 0 | 18 |
| Criminal Justice | 0 | 36 | 21 | 1 | 1 | 0 | 59 |
| Cyber Operations | 1 | 14 | 0 | 0 | 1 | 0 | 16 |
| Electrical Engineering | 4 | 6 | 22 | 1 | 2 | 0 | 35 |
| English | 0 | 3 | 0 | 0 | 0 | 0 | 3 |
| Exercise Science | 3 | 34 | 0 | 0 | 1 | 0 | 38 |
| Finance | 3 | 45 | 0 | 0 | 3 | 0 | 51 |
| History | 0 | 13 | 0 | 0 | 0 | 0 | 13 |
| Intelligence and Security Studies | 1 | 88 | 18 | 1 | 9 | 0 | 117 |
| Management | 3 | 59 | 0 | 0 | 2 | 0 | 64 |
| Marketing & Business Development | 0 | 62 | 0 | 0 | 3 | 0 | 65 |
| Mathematics | 0 | 4 | 0 | 0 | 0 | 0 | 4 |
| Mechanical Engineering | 8 | 32 | 23 | 1 | 8 | 0 | 72 |
| Modern Language | 0 | 1 | 0 | 0 | 0 | 0 | 1 |
| Nursing | 0 | 17 | 27 | 0 | 2 | 0 | 46 |
| Physical Education | 0 | 2 | 0 | 0 | 1 | 0 | 3 |
| Physics | 0 | 4 | 0 | 0 | 1 | 0 | 5 |
| Political Science | 1 | 29 | 4 | 1 | 0 | 0 | 35 |
| Pre-Secondary Education | 0 | 2 | 0 | 0 | 0 | 0 | 2 |
| Psychology | 0 | 11 | 0 | 0 | 1 | 0 | 12 |
| Secondary Education | 0 | 3 | 0 | 0 | 1 | 0 | 4 |
| Sport Management | 0 | 10 | 0 | 0 | 1 | 0 | 11 |
| Strength and Conditioning | 0 | 0 | 13 | 0 | 0 | 0 | 13 |
| Supply Chain Management | 0 | 44 | 0 | 1 | 1 | 0 | 46 |
| Tactical Strength & Conditioning | 0 | 0 | 6 | 0 | 0 | 0 | 6 |
| Undeclared Undergraduate | 0 | 0 | 11 | 1 | 0 | 255 | 267 |
| Total | 26 | 611 | 235 | 14 | 46 | 255 | 1187 |
Graduate Enrollment by Primary Program
| Primary Program | Graduate Students |
|---|---|
| Cert: Cyber Studies | 1 |
| Cert: Higher Education Leadership | 2 |
| Cert: Intelligence Analysis | 6 |
| Cert: Leadership | 2 |
| Cert: Military Leadership | 1 |
| Cert: Student Affairs | 1 |
| Cert: Technical Project Management | 7 |
| EDS Educational Leadership | 1 |
| EDS School Psychology | 30 |
| MA English | 5 |
| MA Intelligence and Security Studies | 53 |
| MA International Politics and Military Affairs | 15 |
| MA Military History | 38 |
| MA Psychology | 79 |
| MA Social Science | 4 |
| MA Sport Management | 4 |
| MAT Middle Grades | 7 |
| MAT Physical Education | 7 |
| MAT Secondary Education | 13 |
| MBA Business Administration | 238 |
| MED Counselor Education | 42 |
| MED Educational Leadership | 57 |
| MED Higher Education Leadership | 11 |
| MED Interdisciplinary STEM Education | 26 |
| MED Literacy Education | 14 |
| MS Civil Engineering | 16 |
| MS Computer and Information Sciences | 4 |
| MS Electrical Engineering | 5 |
| MS Health Exercise Sports Science | 10 |
| MS in Leadership | 38 |
| MS Instruction Systems Design & Performance Improvement | 2 |
| MS Mechanical Engineering | 15 |
| MS Project Management | 35 |
| Undeclared Graduate | 8 |
| Total | 797 |
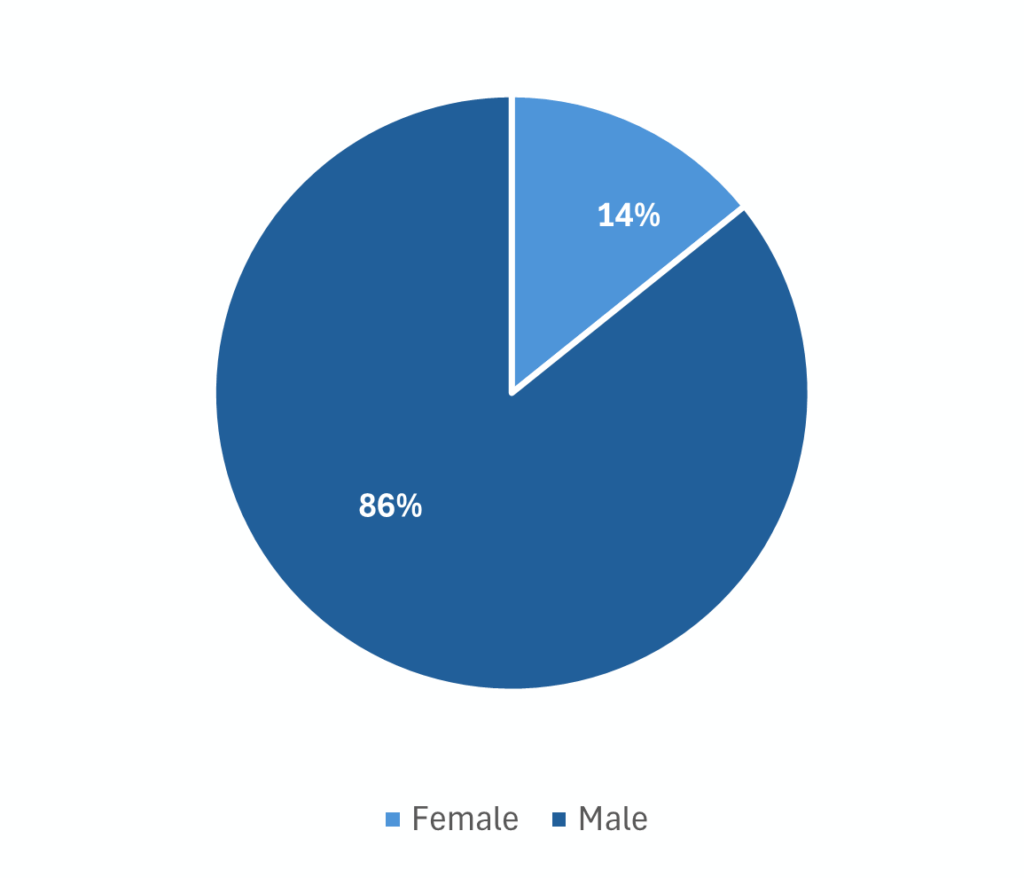
Enrollment by Veteran Status
| Air Force | Army | Coast Guard | Marines | Navy | Total | |
|---|---|---|---|---|---|---|
| College Transfer Program Students | 5 | 12 | 2 | 7 | 14 | 40 |
| Graduate Students | 30 | 42 | 4 | 30 | 36 | 142 |
| Veteran Students (Day) | 2 | 8 | 1 | 14 | 16 | 41 |
| Total | 37 | 62 | 7 | 51 | 66 | 223 |
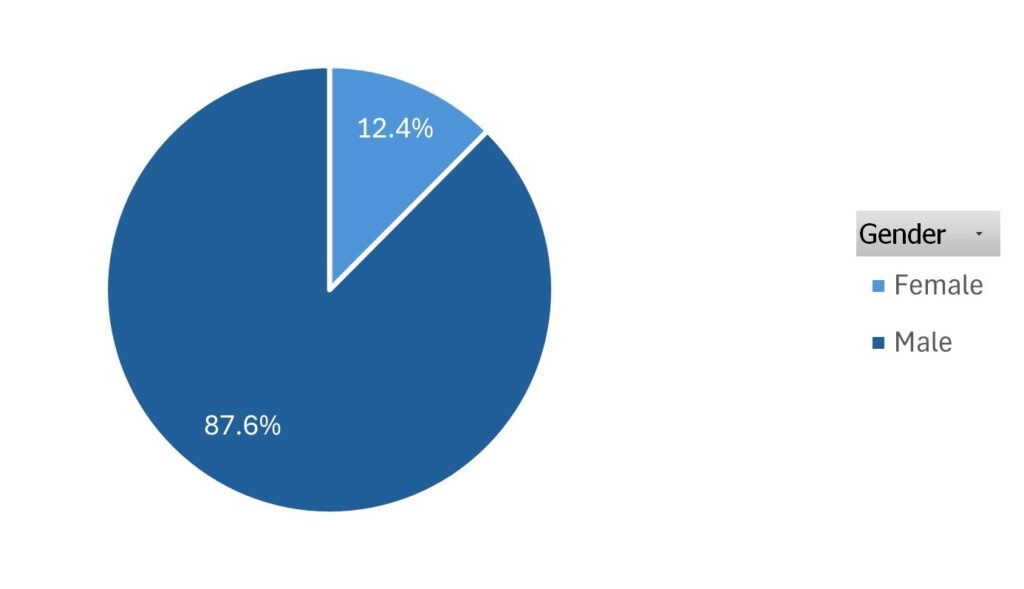
South Carolina Corps of Cadets
South Carolina Corps of Cadets – Gender
| Gender | Count |
|---|---|
| Female | 87 |
| Male | 524 |
| Total | 611 |
South Carolina Corps of Cadets – Race/Ethnicity
| SCCC | Count of Race/Ethnicity | Percent of Race/Ethnicity |
|---|---|---|
| American Indian or Alaskan Native | 2 | 0.3% |
| Asian | 10 | 1.6% |
| Black or African American | 59 | 9.7% |
| Hispanic | 55 | 9.0% |
| More Than 1 Race | 25 | 4.1% |
| Native Hawaiian or Pacific Islander | 1 | 0.2% |
| Non-Resident Alien | 4 | 0.7% |
| Unknown | 7 | 1.1% |
| White | 448 | 73.3% |
| Total | 611 | 100.0% |
South Carolina Corps of Cadets – Cadet Type
| SCCC | Count | Percent |
|---|---|---|
| 1st Year Cadet | 188 | 30.8% |
| 2nd Year Cadet | 192 | 31.4% |
| 3rd Year Cadet | 188 | 30.8% |
| 4th Year Cadet | 32 | 5.2% |
| 5th Year Cadet | 1 | 0.2% |
| Cadet Studying Abroad | 4 | 0.7% |
| Cadet Studying Away | 6 | 1.0% |
| Total | 611 | 100.0% |
South Carolina Corps of Cadets – Primary Program
| Primary Program | Count | Percent |
|---|---|---|
| Accounting | 11 | 1.8% |
| Biology | 31 | 5.1% |
| Business Administration | 2 | 0.3% |
| Chemistry | 6 | 1.0% |
| Civil Engineering | 18 | 2.9% |
| Computer Engineering | 1 | 0.2% |
| Computer Science | 7 | 1.1% |
| Construction Engineering | 16 | 2.6% |
| Criminal Justice | 36 | 5.9% |
| Cyber Operations | 14 | 2.3% |
| Electrical Engineering | 6 | 1.0% |
| English | 3 | 0.5% |
| Exercise Science | 34 | 5.6% |
| Finance | 45 | 7.4% |
| History | 13 | 2.1% |
| Intelligence and Security Studies | 88 | 14.4% |
| Management | 59 | 9.7% |
| Marketing & Business Development | 62 | 10.1% |
| Mathematics | 4 | 0.7% |
| Mechanical Engineering | 32 | 5.2% |
| Modern Language | 1 | 0.2% |
| Nursing | 17 | 2.8% |
| Physical Education | 2 | 0.3% |
| Physics | 4 | 0.7% |
| Political Science | 29 | 4.7% |
| Pre-Secondary Education | 2 | 0.3% |
| Psychology | 11 | 1.8% |
| Secondary Education | 3 | 0.5% |
| Sport Management | 10 | 1.6% |
| Supply Chain Management | 44 | 7.2% |
| Total | 611 | 100.0% |
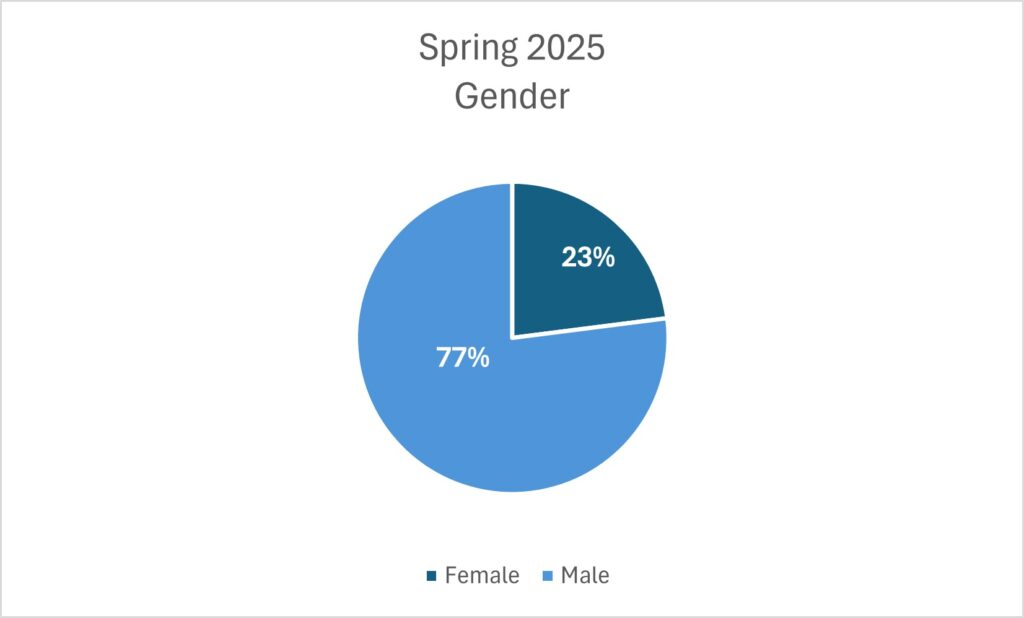
Spring 2025 Enrollment Snapshot
Student Level
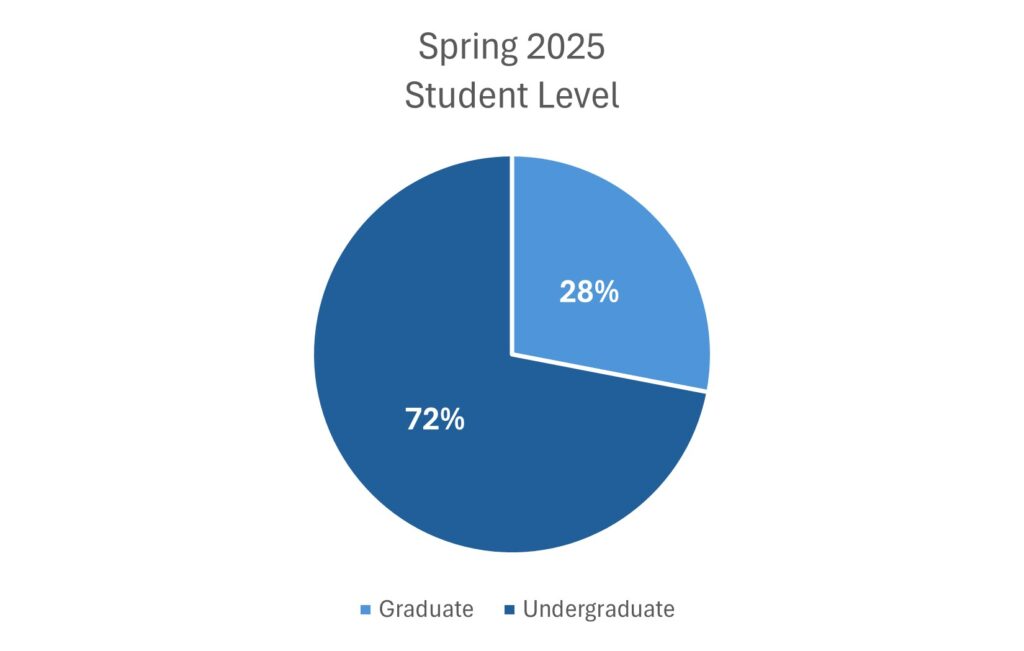
| Student Level | Count | Percent |
|---|---|---|
| Graduate | 1023 | 28% |
| Undergraduate | 2627 | 72% |
| Total | 3650 | 100% |
Residency
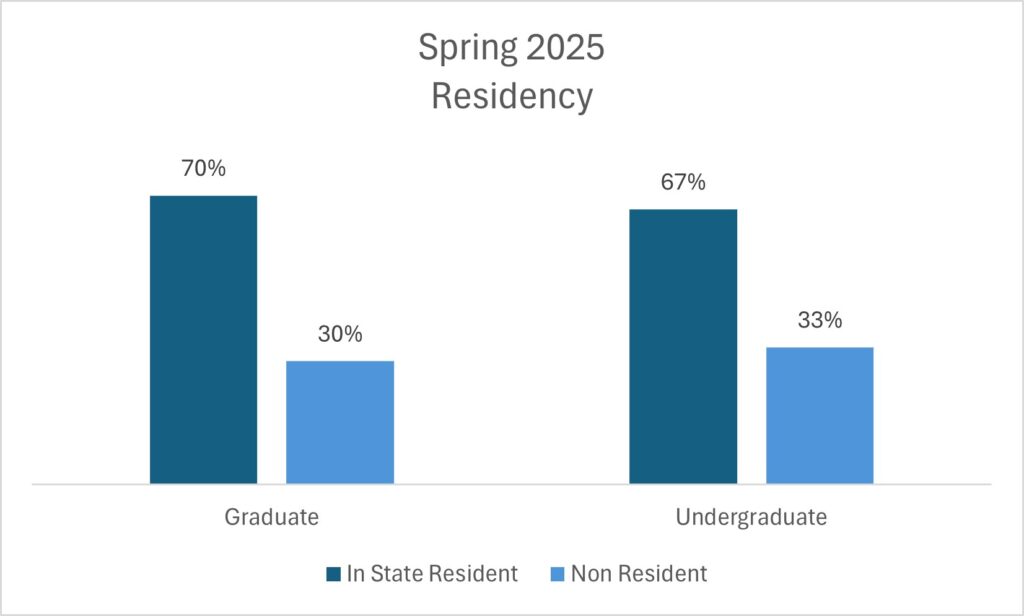
| Non-Resident | In-State Resident | Veteran Benefits* (I) | Full-Time Employees & Dependents* (C) | Retired Persons & Dependents*(D) | Scholarships provided by BOV* (F) | Military Personnel & Dependents* (A) | Total | |
|---|---|---|---|---|---|---|---|---|
| Graduate | 306 | 702 | 11 | 2 | 2 | 1023 | ||
| Undergraduate | 874 | 1503 | 185 | 3 | 3 | 50 | 9 | 2627 |
| Total | 1180 | 2205 | 196 | 3 | 3 | 52 | 11 | 3650 |
*Residency Exception – “In-State Residency” for CHE Residency Classification for Fee Purposes
Gender
| Student Type | Female | Male |
|---|---|---|
| Active Duty | 0 | 31 |
| Cadets | 275 | 1934 |
| College Transfer Program Students | 63 | 169 |
| Fifth Year Day Students | 4 | 32 |
| Graduate | 466 | 544 |
| Veteran Day Students | 8 | 80 |
| Non-Degree Seeking | 23 | 21 |
| Total | 839 | 2811 |
Race/Ethnicity
| Student Type | American Indian or Alaskan Native | Asian | Black or African American | Hispanic | More than 1 Race | Native Hawaiian or Pacific Islander | Non-Resident Alien | Unknown | White | Total |
|---|---|---|---|---|---|---|---|---|---|---|
| Active Duty | 1 | 0 | 3 | 4 | 5 | 0 | 0 | 0 | 18 | 31 |
| Cadets | 8 | 49 | 173 | 203 | 98 | 6 | 21 | 21 | 1630 | 2209 |
| College Transfer Program Students | 0 | 4 | 23 | 27 | 7 | 1 | 0 | 5 | 165 | 232 |
| Fifth Year Day Students | 0 | 2 | 5 | 1 | 1 | 0 | 0 | 0 | 27 | 36 |
| Graduate Students | 2 | 29 | 108 | 69 | 35 | 2 | 2 | 27 | 749 | 1023 |
| Transient Students | 0 | 0 | 2 | 0 | 0 | 0 | 0 | 21 | 8 | 31 |
| Veteran Day Students | 1 | 3 | 7 | 8 | 3 | 1 | 0 | 1 | 64 | 88 |
| Total | 12 | 87 | 321 | 312 | 149 | 10 | 23 | 75 | 2661 | 3650 |
School Enrollments
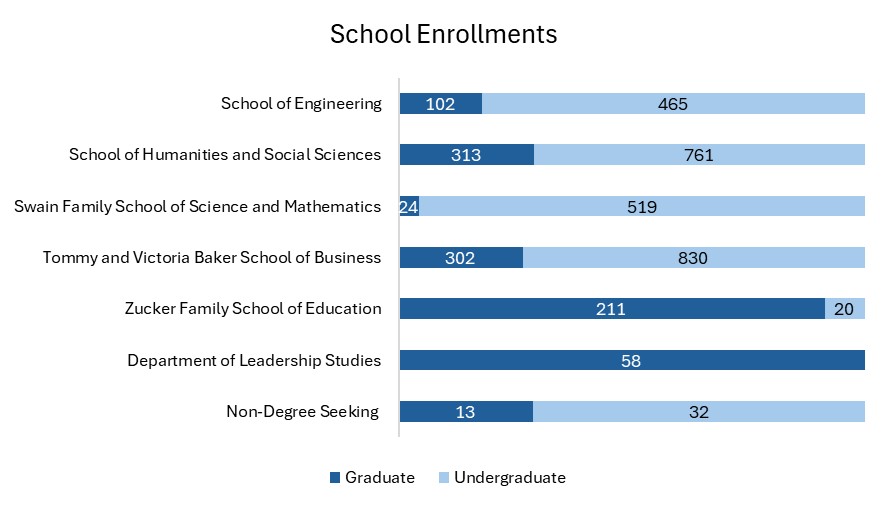
| School | Active Duty | Cadets | College Transfer Program Students | Fifth Year Day Students | Graduate Students | Transient Students | Veteran Day Students | Total |
|---|---|---|---|---|---|---|---|---|
| School of Engineering | 17 | 336 | 73 | 11 | 102 | 0 | 28 | 567 |
| School of Humanities and Social Sciences | 4 | 676 | 52 | 9 | 313 | 0 | 20 | 1074 |
| Swain Family School of Science and Mathematics | 4 | 455 | 37 | 4 | 24 | 0 | 19 | 543 |
| Tommy and Victoria Baker School of Business | 6 | 724 | 69 | 11 | 302 | 0 | 20 | 1132 |
| Zucker Family School of Education | 0 | 18 | 0 | 1 | 211 | 0 | 1 | 231 |
| Department of Leadership Studies | 0 | 0 | 0 | 0 | 58 | 0 | 0 | 58 |
| Non-Degree Seeking | 0 | 0 | 1 | 0 | 13 | 31 | 0 | 45 |
| Total | 31 | 2209 | 232 | 36 | 1023 | 31 | 88 | 3650 |
Undergraduate Enrollment by Primary Program
| Primary Program | Active Duty | Cadets | College Transfer Program Students | Fifth Year Day Students | Transient Students | Veteran Day Students | Total |
|---|---|---|---|---|---|---|---|
| Accounting | 1 | 49 | 0 | 1 | 0 | 2 | 53 |
| Biology | 0 | 90 | 0 | 1 | 0 | 1 | 92 |
| Business Administration | 0 | 2 | 69 | 4 | 0 | 1 | 76 |
| Chemistry | 0 | 33 | 0 | 1 | 0 | 1 | 35 |
| Civil Engineering | 0 | 80 | 24 | 4 | 0 | 4 | 112 |
| Computer Engineering | 0 | 9 | 5 | 0 | 0 | 2 | 16 |
| Computer Science | 0 | 34 | 0 | 0 | 0 | 5 | 39 |
| Construction Engineering | 0 | 53 | 3 | 3 | 0 | 2 | 61 |
| Criminal Justice | 0 | 126 | 24 | 3 | 0 | 5 | 158 |
| Cyber Operations | 0 | 65 | 0 | 0 | 0 | 3 | 68 |
| Electrical Engineering | 6 | 37 | 28 | 1 | 0 | 10 | 82 |
| English | 0 | 8 | 0 | 0 | 0 | 0 | 8 |
| Exercise Science | 4 | 106 | 0 | 0 | 0 | 4 | 114 |
| Finance | 3 | 164 | 0 | 2 | 0 | 5 | 174 |
| History | 0 | 48 | 0 | 0 | 0 | 0 | 48 |
| Intelligence and Security Studies | 1 | 320 | 24 | 5 | 0 | 10 | 360 |
| Management | 2 | 192 | 0 | 0 | 0 | 6 | 200 |
| Marketing & Business Development | 0 | 183 | 0 | 2 | 0 | 5 | 190 |
| Mathematics | 0 | 11 | 0 | 0 | 0 | 0 | 11 |
| Mechanical Engineering | 11 | 157 | 13 | 3 | 0 | 10 | 194 |
| Modern Language | 0 | 7 | 0 | 0 | 0 | 0 | 7 |
| Nursing | 0 | 45 | 22 | 1 | 0 | 0 | 68 |
| Physical Education | 0 | 12 | 0 | 0 | 0 | 2 | 14 |
| Physics | 0 | 21 | 0 | 0 | 0 | 2 | 23 |
| Political Science | 2 | 119 | 4 | 1 | 0 | 1 | 127 |
| Psychology | 1 | 48 | 0 | 0 | 0 | 4 | 53 |
| Secondary Education | 0 | 18 | 0 | 1 | 0 | 1 | 20 |
| Sport Management | 0 | 38 | 0 | 1 | 0 | 1 | 40 |
| Strength and Conditioning | 0 | 0 | 15 | 0 | 0 | 0 | 15 |
| Supply Chain Management | 0 | 134 | 0 | 2 | 0 | 1 | 137 |
| Undeclared Undergraduate | 0 | 0 | 1 | 0 | 31 | 0 | 32 |
| Total | 31 | 2209 | 232 | 36 | 31 | 88 | 2627 |
Graduate Enrollment by Primary Program
| Primary Program | Graduate Students |
|---|---|
| Cert: Cyber Studies | 2 |
| Cert: Intelligence Analysis | 11 |
| Cert: Leadership | 6 |
| Cert: Military Leadership | 2 |
| Cert: Student Affairs | 2 |
| Cert: Technical Project Management | 7 |
| EDS Educational Leadership | 1 |
| EDS School Psychology | 37 |
| MA English | 5 |
| MA History | 1 |
| MA Intelligence and Security Studies | 66 |
| MA International Politics and Military Affairs | 20 |
| MA Military History | 63 |
| MA Psychology | 93 |
| MA Social Science | 17 |
| MA Sport Management | 8 |
| MAT Middle Grades | 9 |
| MAT Physical Education | 6 |
| MAT Secondary Education | 13 |
| MBA Business Administration | 302 |
| MED Counselor Education | 52 |
| MED Educational Leadership | 60 |
| MED Higher Education Leadership | 9 |
| MED Interdisciplinary STEM Education | 25 |
| MED Literacy Education | 30 |
| MS Civil Engineering | 21 |
| MS Computer and Information Sciences | 8 |
| MS Electrical Engineering | 3 |
| MS Health Exercise Sports Science | 14 |
| MS in Leadership | 50 |
| MS Instruction Systems Design & Performance Improvement | 4 |
| MS Mechanical Engineering | 17 |
| MS Project Management | 46 |
| Undeclared Graduate | 13 |
| Total | 1023 |
Enrollment by Veteran Status
| Air Force | Army | Coast Guard | Marines | Navy | Total | |
|---|---|---|---|---|---|---|
| College Transfer Program Students | 10 | 11 | 2 | 7 | 13 | 43 |
| Graduate Students | 27 | 56 | 5 | 41 | 40 | 169 |
| Off Campus Students Enrolled in Citadel Courses | 0 | 1 | 0 | 0 | 0 | 1 |
| Veteran Students (Day) | 13 | 25 | 1 | 18 | 28 | 85 |
| Cadets | 0 | 1 | 0 | 0 | 0 | 1 |
| Fifth Year Day Students | 0 | 1 | 0 | 0 | 0 | 1 |
| Total | 50 | 95 | 8 | 66 | 81 | 300 |
South Carolina Corps of Cadets
South Carolina Corps of Cadets – Gender
| Gender | Count |
|---|---|
| Female | 275 |
| Male | 1934 |
| Total | 2209 |
South Carolina Corps of Cadets – Race/Ethnicity
| SCCC | Count of Race/Ethnicity | Percent of Race/Ethnicity |
|---|---|---|
| American Indian or Alaskan Native | 8 | 0.4% |
| Asian | 49 | 2.2% |
| Black or African American | 173 | 7.8% |
| Hispanic | 203 | 9.2% |
| More Than 1 Race | 98 | 4.4% |
| Native Hawaiian or Pacific Islander | 6 | 0.3% |
| Non-Resident Alien | 21 | 1.0% |
| Unknown | 21 | 1.0% |
| White | 1630 | 73.8% |
| Total | 2209 | 100.0% |
South Carolina Corps of Cadets – Cadet Type
| SCCC | Count | Percent |
|---|---|---|
| 1st Year Cadet | 637 | 28.9% |
| 2nd Year Cadet | 554 | 25.1% |
| 3rd Year Cadet | 570 | 25.8% |
| 4th Year Cadet | 411 | 18.6% |
| 5th Year Cadet | 2 | 0.1% |
| Cadet Exchange Program | 1 | 0.0% |
| Cadet Studying Abroad | 21 | 1.0% |
| Cadet Studying Away | 12 | 0.5% |
| Veteran Cadet | 1 | 0.0% |
| Total | 2209 | 100.0% |
South Carolina Corps of Cadets – Primary Program
| Primary Program | Count | Percent |
|---|---|---|
| Accounting | 49 | 2.2% |
| Biology | 90 | 4.1% |
| Business Administration | 2 | 0.1% |
| Chemistry | 33 | 1.5% |
| Civil Engineering | 80 | 3.6% |
| Computer Engineering | 9 | 0.4% |
| Computer Science | 34 | 1.5% |
| Construction Engineering | 53 | 2.4% |
| Criminal Justice | 126 | 5.7% |
| Cyber Operations | 65 | 2.9% |
| Electrical Engineering | 37 | 1.7% |
| English | 8 | 0.4% |
| Exercise Science | 106 | 4.8% |
| Finance | 164 | 7.4% |
| History | 48 | 2.2% |
| Intelligence and Security Studies | 320 | 14.5% |
| Management | 192 | 8.7% |
| Marketing & Business Development | 183 | 8.3% |
| Mathematics | 11 | 0.5% |
| Mechanical Engineering | 157 | 7.1% |
| Modern Language | 7 | 0.3% |
| Nursing | 45 | 2.0% |
| Physical Education | 12 | 0.5% |
| Physics | 21 | 1.0% |
| Political Science | 119 | 5.4% |
| Pre-Secondary Education | 7 | 0.3% |
| Psychology | 48 | 2.2% |
| Secondary Education | 11 | 0.5% |
| Sport Management | 38 | 1.7% |
| Supply Chain Management | 134 | 6.1% |
| Total | 2209 | 100.0% |
Please click on the desired academic term below to access the Enrollment Profile for previous semesters.