The purpose of the Lowcountry Heat Action Plan Toolkit is to educate on the health dangers of extreme heat, provide some background on heat research in the Lowcountry, and increase personal awareness, preparedness and coping strategies for extreme heat events.
Brought to you by:
Charleston’s Heat Challenge
The Charleston coastal region, also referred to as the Lowcountry, is one of the fastest growing population centers in the United States. The climate, history, culture, and beaches draw many new residents from northern states who are not accustomed to heat and humidity. Even long-time residents are noticing something different with the climate as the planet warms. The Lowcountry, as the name would suggest, has always had a problem with water and flooding, which is also becoming worse with climate change. It is important that the region’s heat challenge is not lost in its simultaneous water challenge (Barnes and Dow 2022).
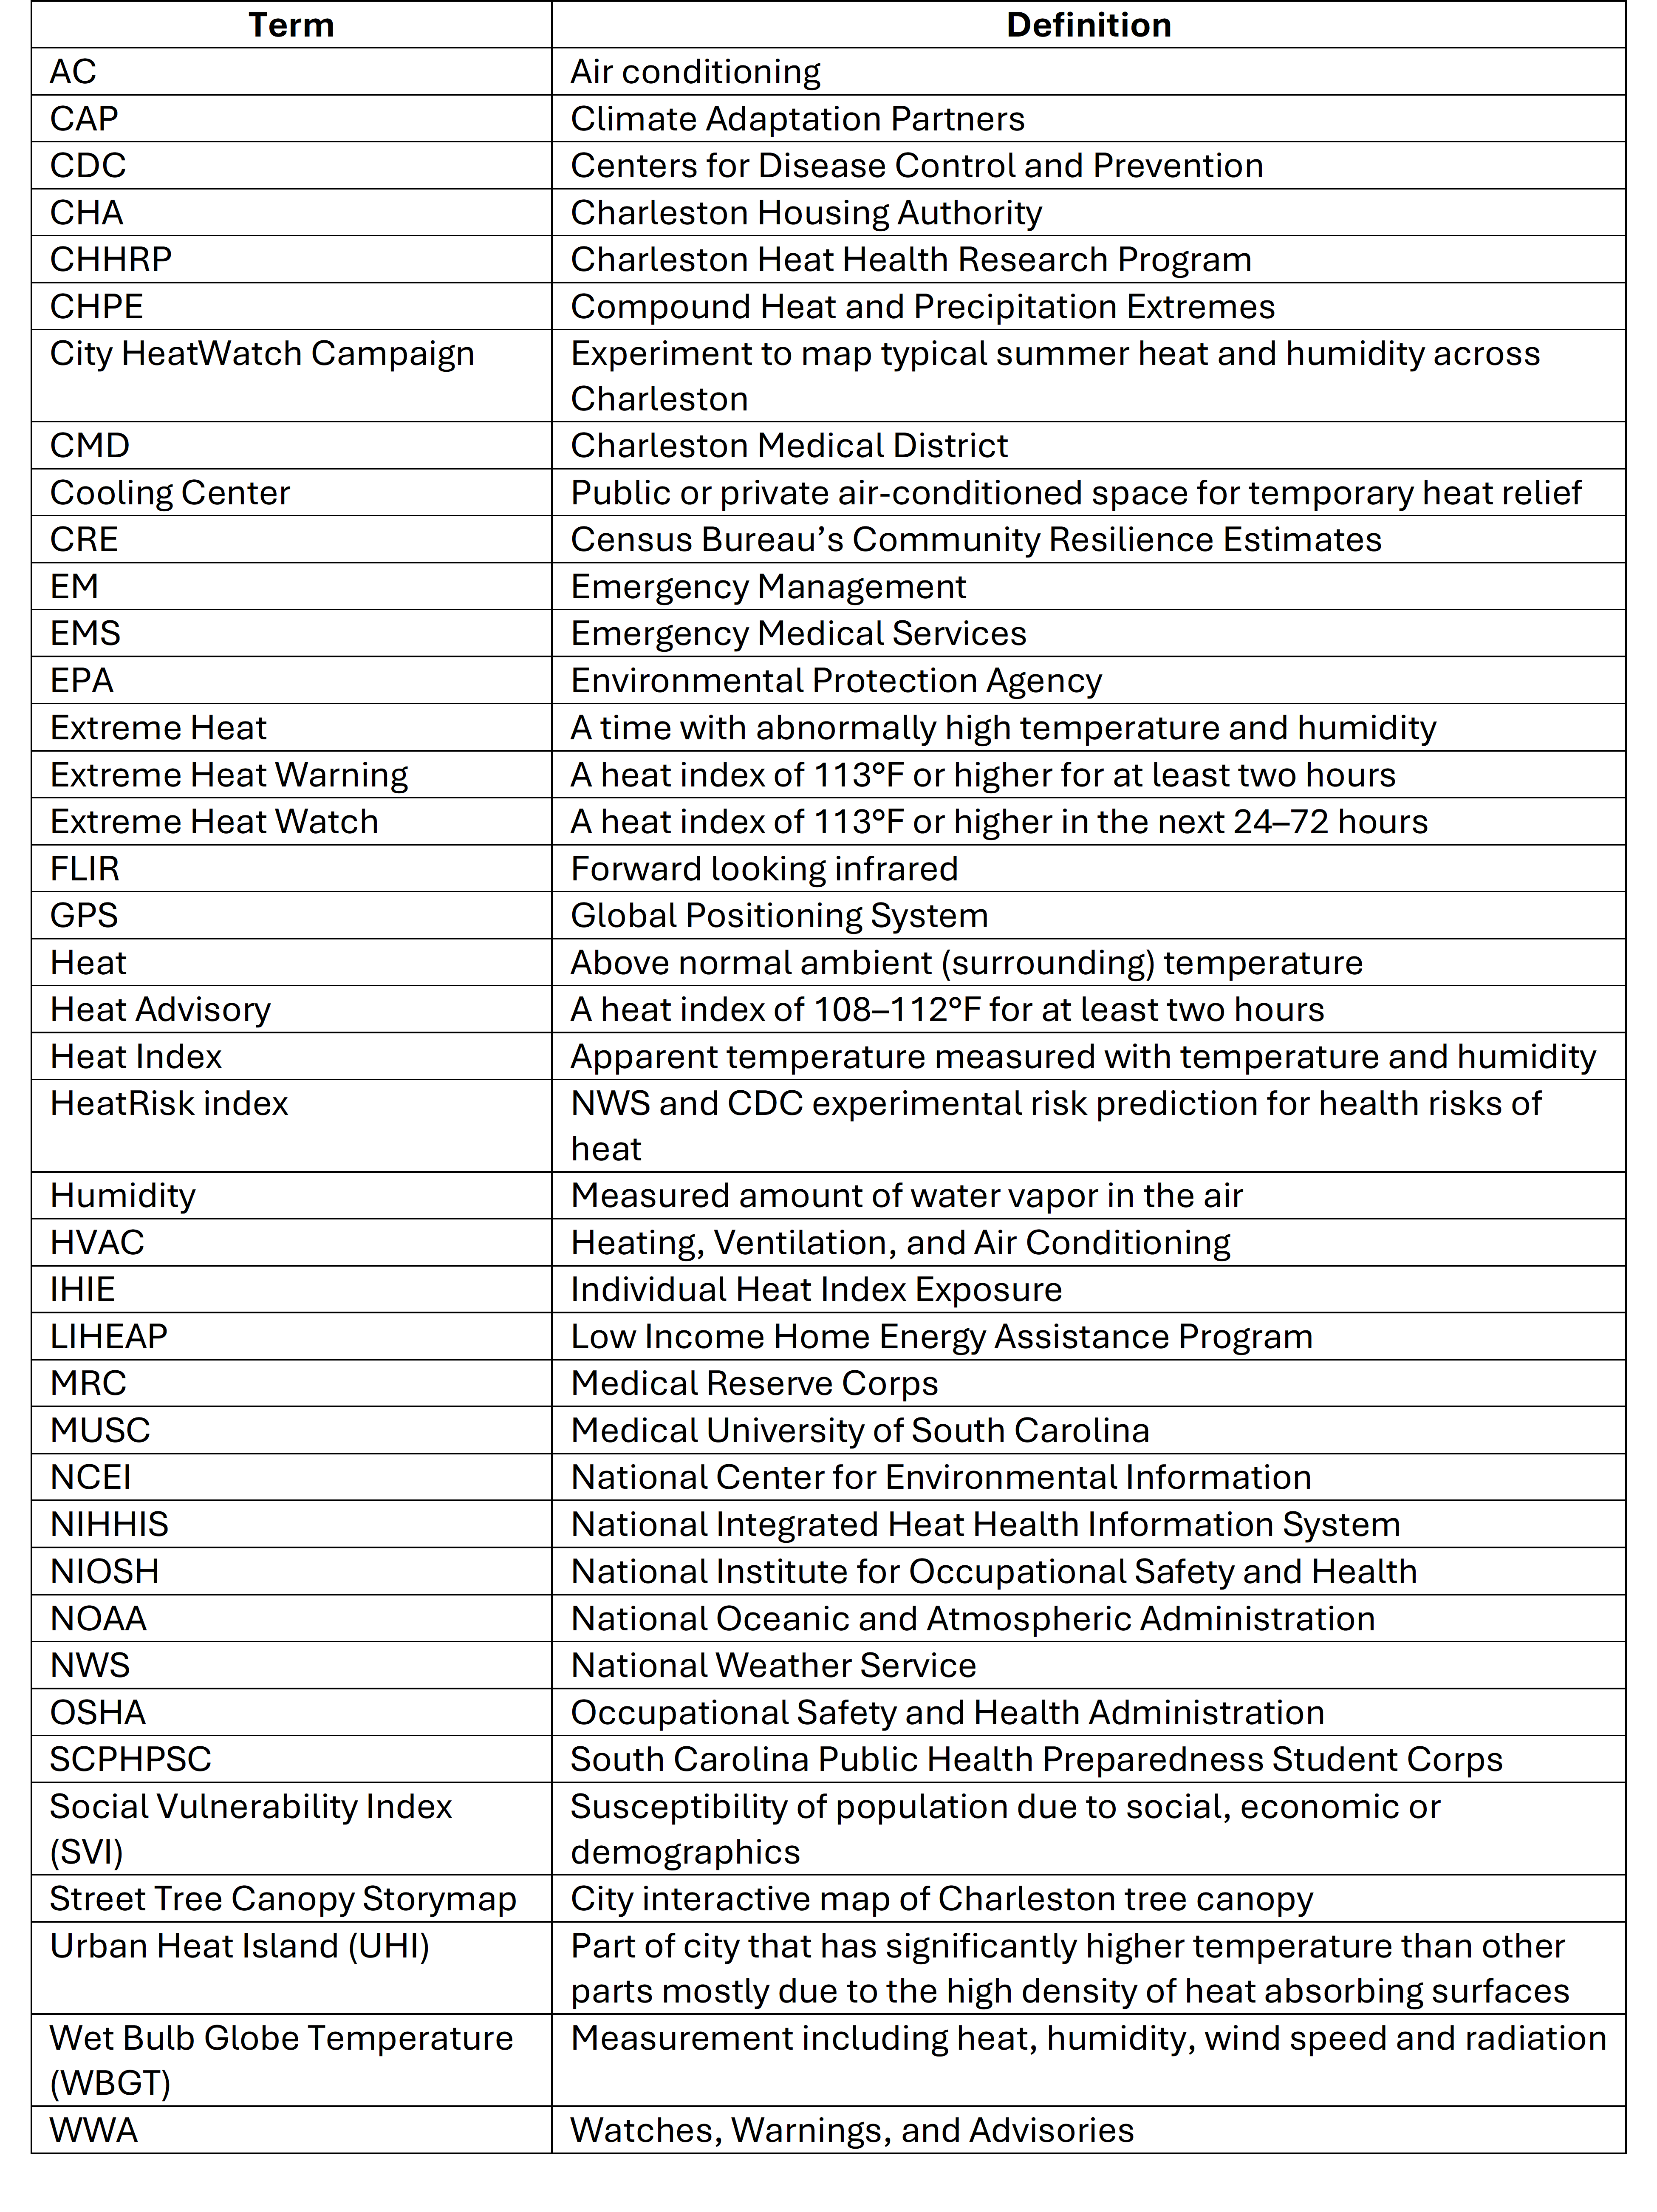
Definitions
Temperature is the obvious starting point, but it is not a complete descriptor of heat risk, especially for the Southeast US. There are three main ways a human can lose heat (cool off) – radiation, winds, and evaporation of sweat. The effectiveness of this last mechanism is highly dependent upon humidity. In 1979 the National Weather Service (NWS) began using heat index, which used biometeorology research to develop an “apparent temperature” based on temperature and humidity. For example, a temperature of 90F and a relative humidity of 70% would produce an apparent temperature of 105F. Heat index is commonly used to communicate how heat “feels”.
The NWS in partnership with the Centers for Disease Control (CDC) has just recently transitioned to another index: HeatRisk. HeatRisk takes into account how unusual the heat is for the time of year, duration of heat (maximum daytime temperatures and minimum nighttime temperatures), and whether the temperatures pose an elevated risk of heat-related impacts based on CDC data. Thus, HeatRisk implicitly takes into account humidity and is more strongly related to health outcomes. Taking a page from flood communication, HeatRisk is also color coded to signal the threat level from minor to extreme.
Finally, wet bulb globe temperature (WBGT) is a complex but more complete measure of how heat affects the body. WBGT has been used by the military since the 1950s and has recently been used by other agencies concerned about outside physical activity: athletics, workers, etc. WBGT not only takes into account temperature and humidity, but also wind speed (recall wind is another way for the body to lose heat), and radiation. Radiation is a further way a person loses heat, but sunshine and hot objects radiate heat towards the person increasing their heat health risk. Thus, given the same temperature, high wind, shade, and low humidity is going to be less risky.
Resources
In addition to new ways of operationally forecasting heat impacts, the federal government has begun to communicate heat and health information for the nation to reduce the health, economic, and infrastructural impacts of extreme heat.
Lowcountry Specifics
The Lowcountry’s heat occurs in the summer months with a peak in July. The 1991-2020 average maximum temperature in July for the Charleston Airport is 91.3 F. Fortunately, the Lowcountry’s summertime climate is somewhat moderated by cooling sea-breezes. For example, further inland Columbia Airport’s average maximum temperature in July is 93.2 F. However, the ocean waters also increase humidity in the Lowcountry so that the heat index can be extreme. The average number of hours of heat index above 105F is 34.8 for Charleston compared to 15.6 for Columbia, and the unofficial state record heat index of 124 F was set in Mount Pleasant, Charleston County in 2011 (SC State Climate Office, 2024).
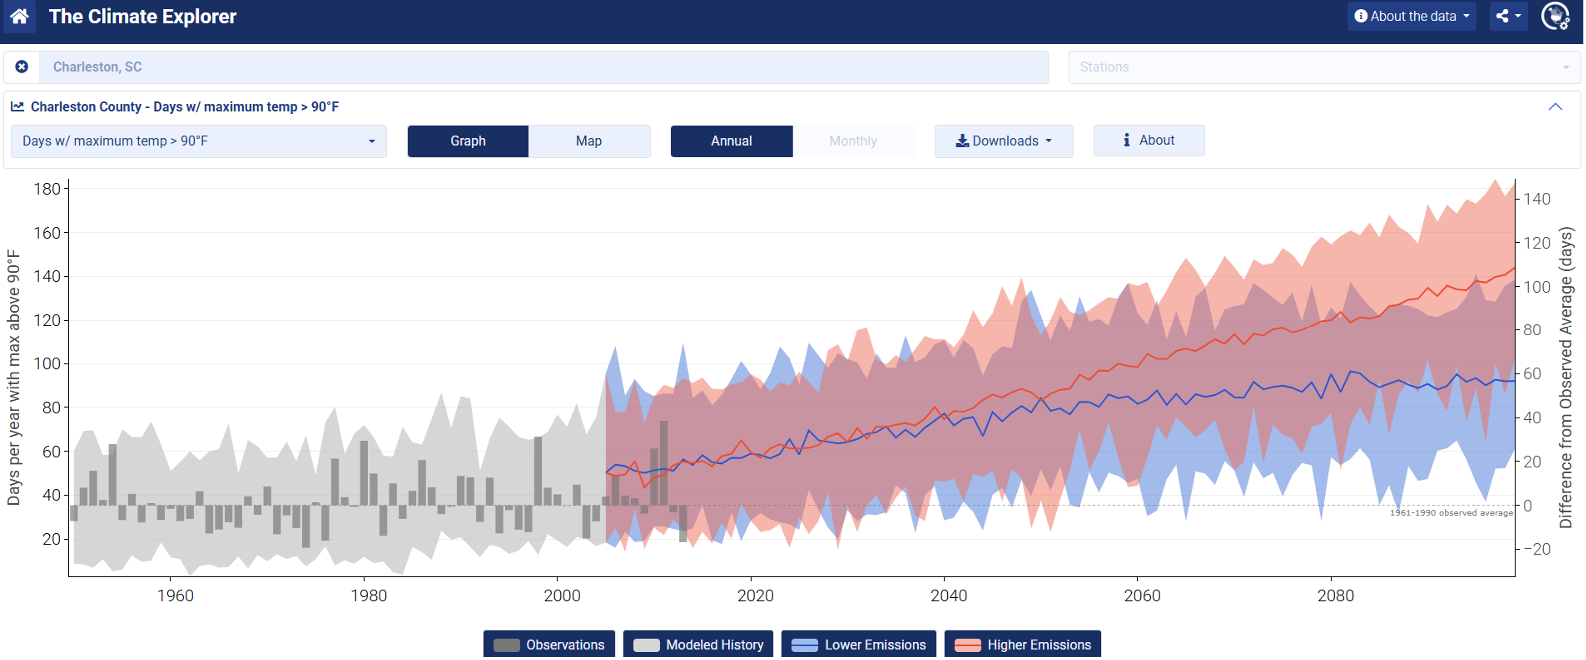
There has been an increase in annual average temperatures across South Carolina since the 1960s, which is mostly explained by a substantial rise in minimum temperatures (SC State Climate Office, 2024). The rise in minimum temperatures is concerning, because warm nights do not allow the body to recover following a heat stressed day. The number of days of extreme heat has also increased in the Lowcountry. The Charleston Airport recorded maximum temperatures of at least 90F for 70 days or more (almost a month and a half during the summer) in 2010, 2011, 2014, 2016, 2018, and 2019. Prior to this recent history, only two years reached this feat (1986 and 1990) since record keeping began in 1938.
Summer of 2024
Charleston’s Future Heat Concerns
Extreme Heat and Health
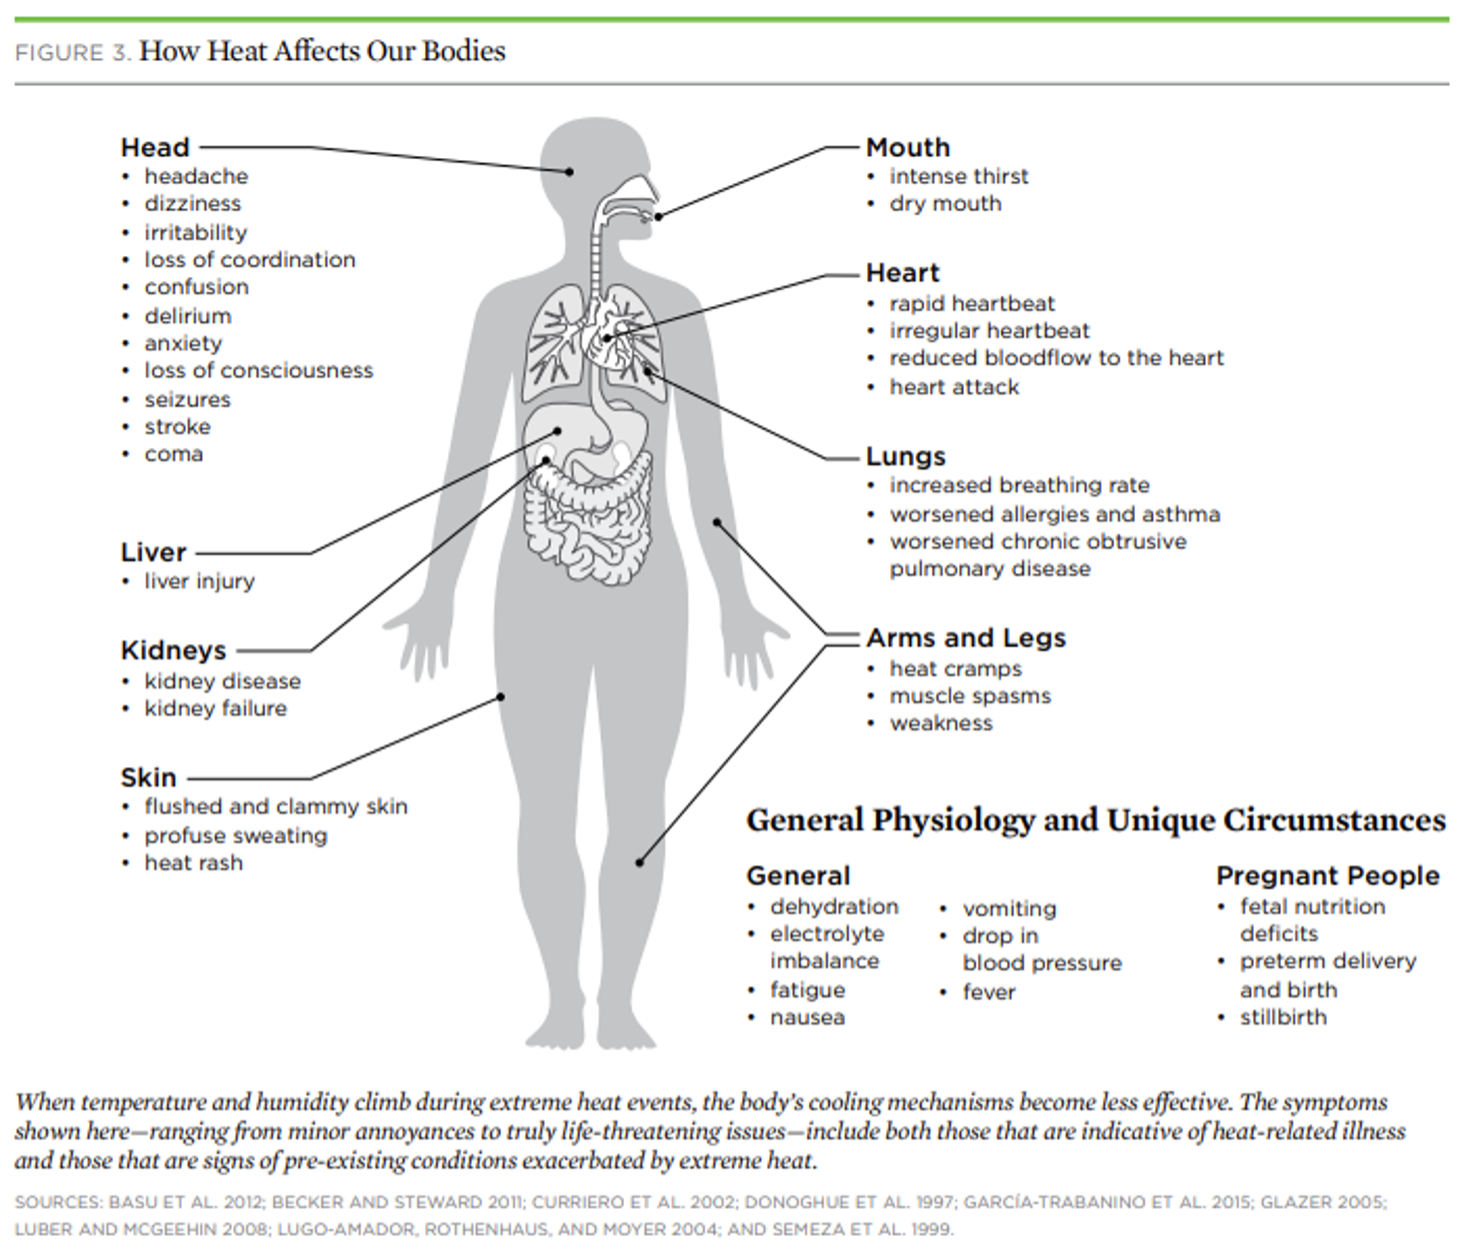
- Across the world, extreme heat is known to be associated with effects on health beyond the immediate emergencies of heat exhaustion/heat stroke. Heat stress occurs when the body’s cooling mechanisms cannot keep up with the heat.
- Extreme heat events have been linked to more deaths, including from motor vehicle crashes, falls, and drowning. Visits to hospitals and emergency department increase in times of extreme heat. The duration of the event may cause more deaths and healthcare visits.
- In pregnant women, extreme heat is related to preterm birth. As in many other areas of health, there may be differences in health effects of heat by race. One study found that non-Hispanic black women were more likely to have preterm birth than non-Hispanic white women exposed to the same temperature. Heat stress can affect those with respiratory disease, cardiovascular disease, and older adults more.
- There are regional differences in the effects of heat on health; therefore, lessening the health effects of heat will require region-specific information. For example, climate change is predicted to increase heat events in general. These events are likely to feel worse in the more northern areas of the U.S., an area with less experience in coping with extreme heat. Here in Charleston, we already cope with high humidity which makes the extreme heat feel worse. Higher humidity makes it harder for the body to dissipate excess heat. A combination of adapting to the climate and coping strategies by the population seems to lessen the health effects in other similar hot/humid areas compared with hot/dry areas. However, we do expect to see slightly higher numbers of deaths with more extreme heat days. An interaction of air pollution and heat compounds the effect; those with more exposures to high levels of air pollution tend to also be people with low income or of minoritized groups.
Stepping Up to the Challenge: Charleston’s Heat Research
Beginning in 2020 with targeted research at the Charleston Medical District, research and exploration on Charleston’s exposures to extreme heat continues to grow as does research collaboration and pilot project development. The figure below illustrates progress.
Water, Heat, Transportation Charrettes
In 2020, the Charleston Medical District Advisory Group and Climate Adaptation Partners (CAP) conducted surface temperature sampling at the Charleston Medical District (CMD). The intention was to capture surface temperatures at public gathering areas, recognizing the challenge of COVID-19 and the need for outdoor respite. Over the course of a typical summer day, CAP captured FLIR imagery at gathering spaces and walking routes across the properties of the three CMD institutions. CAP coded these data according to material types and geolocation. Coupled with LANDSAT 8 Operational Land Imager (OLI) data, CAP then summarized these through visuals, ultimately illustrating extreme temperatures in recently completed environments, and noting a 40-degree temperature differential across material choices within the CMD. Results were then presented to the CMDAG, recognizing that CMD patients’ exposure to such heat and innate sensitivities to heat in sensitive populations, warrant further attention.
Charleston Heat Mapping Campaign
In 2021, Charleston conducted its first HeatWatch community science campaign. With nearly 30 volunteers on a typical summer day, the team drove 10 routes crosscutting the City of Charleston and portions of North Charleston and captured over 57,000 heat index measurements. Results showed a higher heat impact in areas of denser development, particularly in commercial and industrial areas, with the Peninsula being far warmer than outlying areas. Conserved forests were cooler and had greater cooling impact than water bodies, reducing the concentration of heat near dense single-family neighborhoods. Comparatively, neighborhoods with less tree canopy concentrated heat. There were no effects of swampy areas as compared to regular forest. Across the study area, there was a nearly 12-degree temperature differential. In parallel 3 teams used FLIR cameras to capture representative thermal imagery illustrating surface temperature changes over the day. These images helped to describe the increases in urban heat in paved public spaces such as bikeways and basketball courts, in turn raising heat risk awareness. Results were then presented to the City of Charleston Resilience and Wellness Committee.
Individually Experienced Heat
Many studies report on urban heat islands and variations in temperature and humidity around cities. Often, however, the weather forecast and guidance for heat health safety is based on information for a weather station in a fixed location (e.g., near an airport). In order to better understand individuals’ heat exposure and physiological heat strain, there is a need to better measure how people moving around inside and outside experience heat variability and the physiological impacts.
To address this gap in understanding, in 2021 a study focused on personal heat exposure and estimating heat strain of grounds and public safety workers movements throughout their workplaces (indoors and outdoors) in Charleston, SC (Sugg et al. 2022). Twenty-five workers were equipped with a GPS enabled watch tracking their heart rates (e.g., fitness watch) and a hydrochron ibutton sensor (size of a dime, worn pinned to the outside of a shirt) to measure temperature and humidity at 5-minute intervals to create Individual Heat Index Exposure (IHIE) measures. A higher IHIE metric was positively associated with length of time to heat strain. Comparison with exposure metrics that reflect the intensity, duration, or frequency characteristics of IHIE did not show a significant association with time to heat strain. The IHIE measures were statistically significantly similar to the Heat Index calculated at the weather station, although measurements of temperature and relative humidity individually showed more pronounced differences. The real-time monitoring of heat exposure and physiologic response offers useful insights into temperature and health trends as well as outdoor workers’ coping strategies for high heat days.
WBGT in the Charleston Medical District
Since the WBGT uses several variables to calculate heat, it can vary greatly in short distances, such as between a tennis court and adjacent grass field and sun versus shade (Clark and Konrad 2023). This was demonstrated in Charleston through the Charleston Medical District (CMD) experiment in 2021 which was replicated in Gadsden Green in 2022. In the CMD experiment, 8 Kestrel Heat Trackers were set up in areas frequented by respite seekers, outdoor workers, and transit riders. Some of the highest WBGT readings were found at the patient drop off area at the Veterans Administration hospital due to the impervious surfaces. Some areas in the wind shadow of the medical buildings also recorded high WBGT.
Charleston Heat Health Research Project (CHHRP)
While the previous two studies were led by researchers outside South Carolina, it helped to form the Charleston Heat Health Research Project (CHHRP). The Citadel and S.C. Sea Grant Consortium are leading teams of scientists and community scientists in research evaluating heat impacts in urban environments around the City of Charleston. In 2022, the team measured the heat (WBGT, FLIR cameras) at different locations and on different materials in a public housing community. Findings showed that some of the hottest areas in the community were at the playground and that the color of the asphalt roof affected its temperature. To expand this work, since summer 2023, a subset of the team is measuring the heat coming off roads and sidewalks to assess if a treatment used to extend the life of the road had noticeable secondary benefits as measured in lab. Preliminary results indicate the treatment does not have a notable effect to date but research is ongoing.
Tree Canopy Story Map
One important product from CHHRP was the Tree Canopy Story Map led by the City of Charleston GIS division. The Street Tree Canopy Storymap is an interactive exploration of street tree canopy coverage in Charleston’s subdivisions and its connections to heat and equity, presented through a series of questions and answers. Its primary component is a map of 500+ subdivisions, each a shaded pale-yellow to dark green with a corresponding label denoting their respective street tree canopy coverage. Street tree canopy coverage is defined as the percentage of tree canopy covering the area 50ft on either side of the street centerline (as opposed to total subdivision area coverage). Clicking on a subdivision displays its name, length of street miles, percent street and total canopy as well as percent paved/impervious, and average year built. As the user scrolls down, subdivisions with high canopy coverage are filtered out, followed by new subdivisions where trees are expected to grow and provide more shade in the coming years. The analysis then incorporates temperature data collected during the 2021 Heatwatch campaign, plotting morning, afternoon, and evening temperature against tree canopy coverage. Next, the storymap addresses equity, where low-canopy subdivisions are mapped alongside demographic data like income and race. Clicking on subdivisions in the demographic maps displays population, race, income, and vehicle ownership information. Finally, a comprehensive mapping application with all described layers, plus additional related layers, enables users to explore the data independently. The storymap concludes with a call to action, encouraging citizens to plant trees on their properties.
Charleston Heat Preparedness
Lowcountry Warnings
The National Weather Service (NWS) will issue Watch, Warnings, or Advisories (WWA) for heat when heat indices exceed a specified threshold. The Charleston NWS office recently re-evaluated their WWA criteria to better align with local impacts. Heat-related Emergency Medical Service (EMS) call data from 2020-2022 was obtained from the South Carolina Department of Health and Environmental Control and the Georgia Department of Public Health. Days with the highest frequency of heat-related calls were compared to meteorological observations, specifically the daily maximum temperature, minimum temperature, and maximum heat index. The data supported lowering criteria, since there were several instances where observed heat indices were below current thresholds. Heat Advisories will now be issued for the Charleston area when heat indices are forecast to reach 108-112 F for at least 2 hours or more; Excessive Heat Watch/Warnings will be issued when heat indices are forecast to reach or exceed 113 F for at least 2 hours or more. It is important for everyone to keep track of heat advisories, watches, and warnings just as they would for an approaching storm or hurricane.